The online tool provides an overview of seven key sectors across the City of Melbourne:
- advanced manufacturing
- financial services
- technology
- higher education
- professional services
- life sciences
- retail.
Powered by data from the 2023 Census of Land and Employment (CLUE), the map highlights where specific industries are concentrated and showcases the number of jobs and business establishments in each area, helping investors identify strategic locations to establish their business.
Using the map
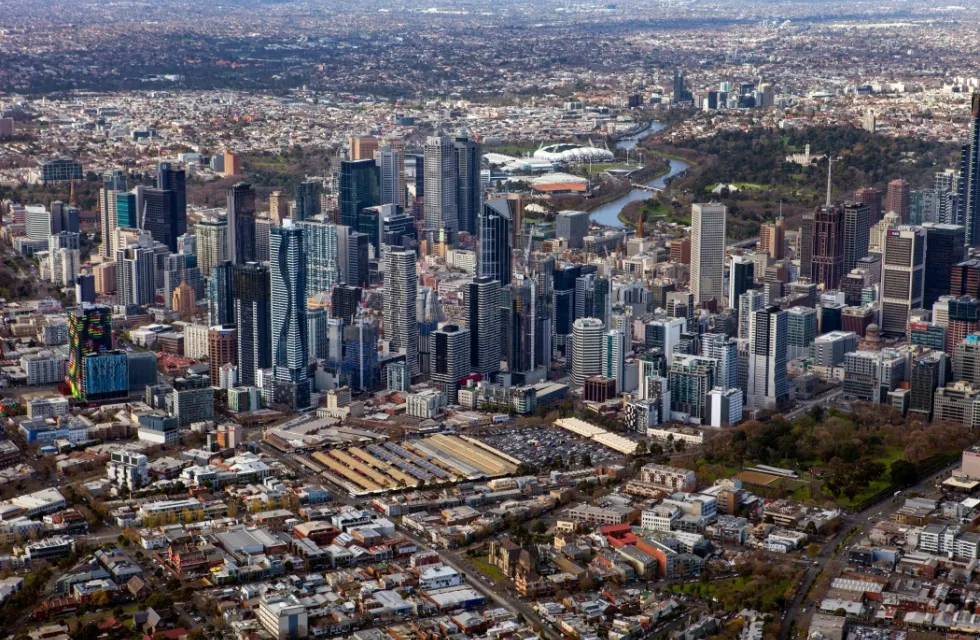
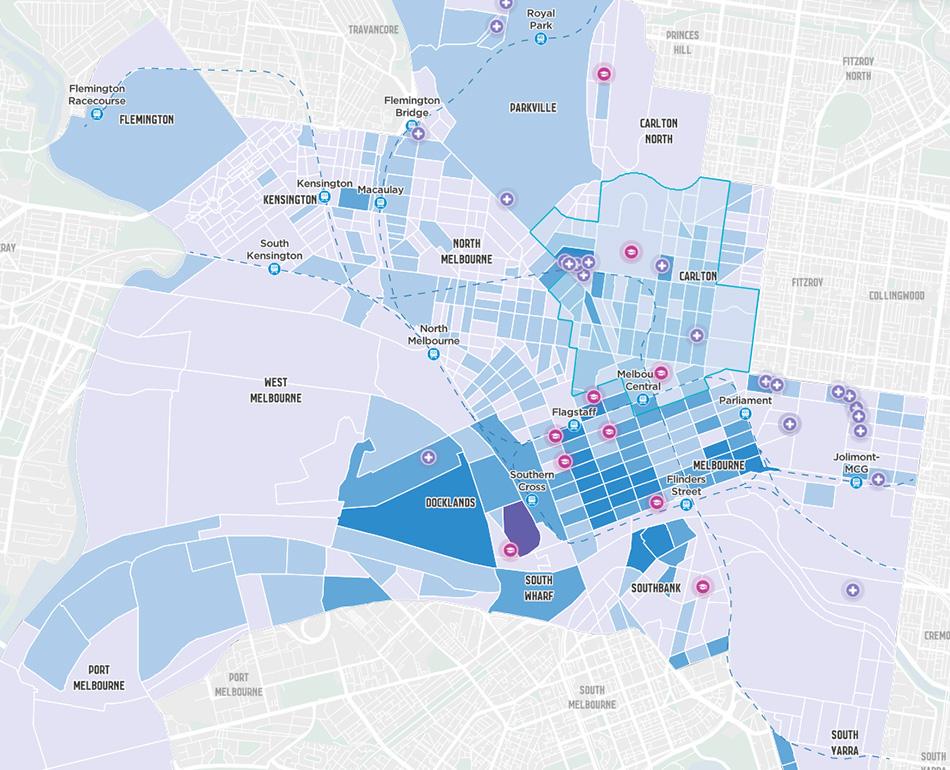
The map provides a visualisation of the City of Melbourne municipality. The black dotted lines indicate train lines running through the city, and the blue shaded area represents the Melbourne Innovation District External link.
Different views or layers can be applied to the map according to your areas of interest. To turn layers on and off, use the layer icon from the left panel menu.
When using the map, please note that businesses and jobs cannot be viewed simultaneously. Similarly, key sectors within businesses and jobs can only be viewed one at a time. Select either businesses or jobs and a single key sector in the layers menu. Darker colours represent a higher concentration of businesses or jobs in a particular area, depending on your layer settings. Note: both businesses and jobs layers are ticked by default when opening the map.
Context labels and data, such as key sites, education institutions, train stations and hospitals, will appear as you zoom into the map. You will be able to see the number of jobs and businesses by clicking on the coloured polygons.
Additional support
For support using the map or for more information on investing in Melbourne, contact investmelbourne@melbourne.vic.gov.au

